
AI Observability: How to Monitor Agentic AI After Deployment
AI Observability: How to Monitor Agentic AI After Deployment
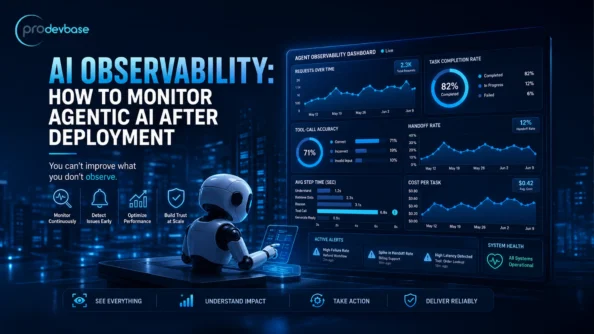
When an agentic AI system goes live, knowing whether it is working correctly is not enough. AI observability helps teams understand what their AI agents are doing after deployment by tracking traces, tool calls, performance, costs, errors, and unexpected behavior. Without proper observability, problems can remain hidden until they affect customers or business operations.
No crash. No alert. The agent made a bad decision, and nothing in the monitoring stack was built to notice that. This is the problem AI observability exists to solve. When software chooses its own tools and its own next step, watching the servers isn’t enough. You have to watch the choices.
Why Agentic Systems Break the Old Rules
Regular software is boring in a good way. Same input, same output. That’s why error rate and uptime became the standard health checks.
Agents ignore that deal. One reads a goal, makes a plan, calls a few tools, looks at what came back, and changes direction. Send it the same request twice and you may get a three-step run the first time and a nine-step run the second, with two retries in the middle.
So the dashboard can be green while the work is wrong. Picture the agent calling the wrong tool, getting an empty response, and treating that blank as permission. Latency is fine. Logs are quiet. The outcome is still bad.
Monitoring tells you something broke. Observability tells you where and why. When you’re trying to fix a live problem, that difference is most of the battle.
Traces Come First
A trace is the full record of one run: the request that started it, each model call, each tool call, and whatever the agent did at the end.
Skip traces and you’ll be guessing. Back to the refund case. Maybe the agent grabbed an outdated policy file. Maybe a tool returned nothing and the agent made something up to fill the hole. With a trace, an engineer reads the run like a chat transcript and spots the bad step in a few minutes.
Some small habits pay off here. Log the documents the agent pulled in, not just what it said at the end. Keep token counts and timing for every step. And if several agents pass work between them, give the task one shared trace ID, otherwise you’ll lose the thread at the first handoff.
For tooling, Langfuse, LangSmith, and Arize Phoenix all do this well for LLM apps. OpenTelemetry also has conventions for generative AI. Following an open standard means you aren’t stuck if you want to switch later.
Also read: How Agentic AI Is Transforming Finance: Use Cases, Business Benefits, and Implementation
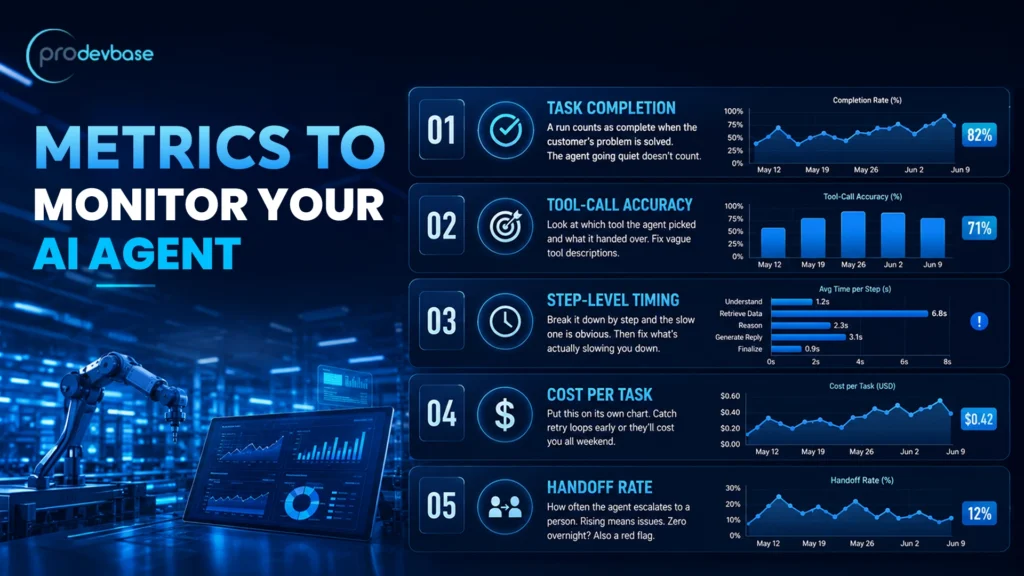
AI Observability Metrics Worth Watching
Thirty charts look impressive in a demo. During an incident nobody reads them. Start with five.
AI Observability for Task completion.
A run counts as complete when the customer’s problem is solved. The agent going quiet doesn’t count. You need to decide what “solved” means for each workflow before launch, because a ticket marked closed while the customer still waits is a failure no matter what the logs claim.
AI Observability for Tool-call accuracy.
Look at which tool the agent picked and what it handed over. Suppose it keeps calling the order-lookup tool with no order ID. People tend to blame the model, but the tool description is the usual suspect. It’s too vague. Two lines of rewriting often solve it.
Step-level timing.
A single average for the whole run hides everything. Break it down by step and the 3slow one is obvious. Sometimes it’s the model. Sometimes it’s a database query nobody ever indexed.
AI Observability forCost per task.
Put this on its own chart. An agent caught in a retry loop will happily run all weekend and charge you for each try. Better to catch that Friday night than to open the invoice on Monday.
Handoff rate.
That’s how often the agent escalates to a person. A rising rate means something broke or drifted. A rate that falls to zero overnight deserves suspicion too, since the agent may have stopped asking for help when it needed to.
Not sure what your agents are doing in production?
Prodevbase works with teams running agentic AI in the real world. We look at your current setup, flag the gaps in logging and cost tracking, and help close them before a customer finds the problem for you.
[Book a Free Consultation]
Don’t Stop Testing at Launch
Tests written before launch cover the cases your team could imagine. Real users imagine far more.
So AI observability has to continue once the agent is live, helping your team track performance and catch problems that appear in real-world usage.
Automated checks cover the basics: format, required fields, policy rules. A second model can grade tone and relevance, though you should spot-check that judge now and then, because it makes mistakes too. And once a week, have a person read a small batch of real runs. A human finds in half a minute what a dashboard never will.
Keep your failures. Every bad run goes into a regression set, and you replay that set whenever a prompt or model changes. After a few months it’s probably the best test suite you have, since each case came from something that really went wrong. [Add one real example from your own work here.]
Scoring every single run gets pricey. Sample instead: a random slice of traffic, plus every run that ended in an error or a handoff.
AI Observability Helps Detect Drift
Agents change even when no one touches the code. The model provider ships an update. Someone edits a policy document. Customers start asking questions nobody planned for. An API quietly renames a field.
None of that raises an error. The agent just gets a bit worse each week, and nobody can say exactly when it started.
With AI observability, take a baseline in launch week, then check completion rates and evaluation scores against it every month.
Pin your model versions as well. That way you decide when a change arrives instead of learning about it afterward.
Guardrails and Human Approval
Observability shows you what’s wrong. Guardrails keep the damage small while you fix it.
Start with permissions. Give the agent access to what its job needs and nothing beyond that. A support agent doesn’t belong anywhere near billing tables. Next, put an approval step in front of risky actions like deleting records or moving money. Someone clicks approve, then the agent goes on.
Security needs real attention too. Agents read content from outside sources, and a hidden instruction buried in a web page can send one off course. OWASP lists prompt injection among the top risks for LLM applications. If you log every tool input and output, an attack like that is much easier to trace.
Go easy on alerts. Fire them for things that matter, like a cost spike or a drop in completion rate. If the channel is noisy all day, people mute it, and then the one alert that counts goes unseen.
What to Build, in What Order
Trying to build everything in one go usually stalls out. A calmer sequence works better. Turn on tracing on day one. Choose a single success metric for each workflow. Add cost and step-level timing. Run automated evaluations on sampled traffic. Finally, review failures every week and put approval gates on the risky actions.
Visibility comes first, and control comes after. Each step is useful on its own, so you never end up with a half-finished project waiting on the next piece.
How ProDevBase Uses AI Observability
Building AI observability takes real engineering hours, and most product teams would rather spend them on features. Prodevbase builds that layer for you: tracing pipelines, evaluation workflows, and monitoring dashboards for agentic AI. The idea is that visibility ships with the agent, instead of being patched in after the first incident.
Already live? We can audit what you have. We check logging, cost control, and guardrails for gaps, then rank the fixes by risk so you know where to start.
Final Thoughts
Agents are taking on bigger jobs, and trust depends on being able to explain what they did. Traces, a short list of metrics, and steady evaluation get you there.
You don’t need all of it at once. Pick one workflow. Decide what success looks like. Start tracing.
Ready to put agent monitoring in place?
From your first trace to full production monitoring, Prodevbase can guide the work. Share your current setup and we’ll map out a practical observability plan.
[Talk to Prodevbase]
FAQ
What is AI observability?
It means collecting traces, metrics, and evaluations from an AI system so you can understand and debug how it behaves after launch.
How is it different from regular monitoring?
Monitoring tells you a problem exists. Observability tells you why. An agent can fail while every infrastructure metric looks normal.
What is agent drift?